Area Grading Map
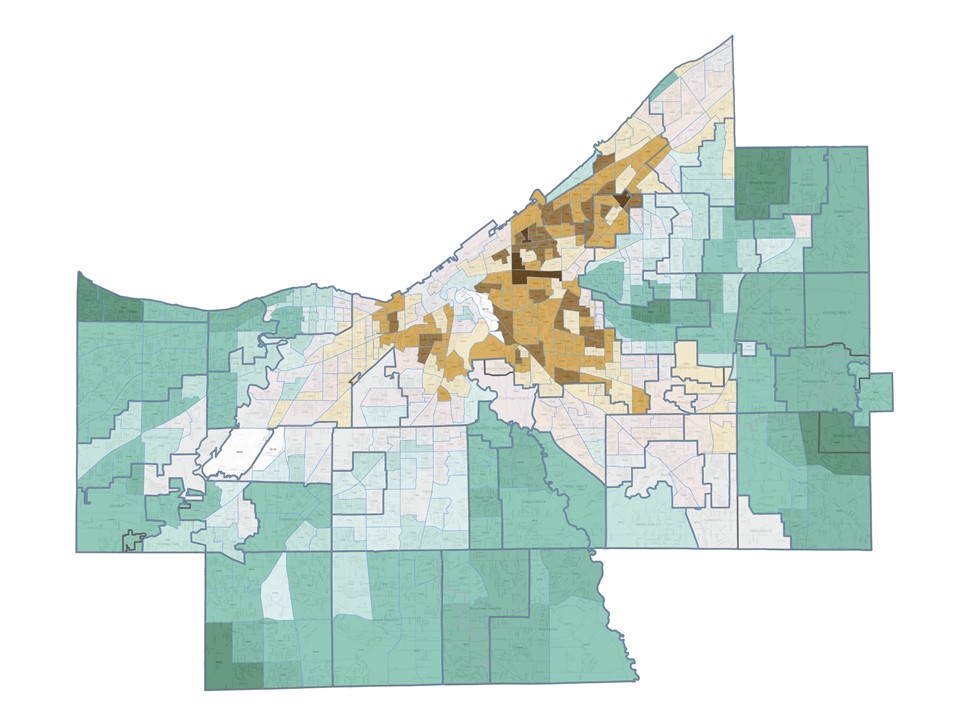
Cuyahoga County Residential Neighborhood Grades
This map has been created as a resource for Cleveland area residential investors to understand the “grade”, from A+ down to F, for each area, down to the census tract level, within Cuyahoga County, the Ohio county in which Cleveland and 58 of its suburbs are located.
CLICK HERE TO OPEN HUGE FULLY ZOOMABLE AND PRINTABLE FULL SIZE MAP
As can probably be readily inferred, an area grade of A+ implies the lowest possible amount of risk, whereas a grade of F implies the highest level of risk.
Grading Approach
By analyzing data down to the census tract level, a more meaningful grade for each area can be developed than would be possible by looking at broader parameters, such as city/suburb, neighborhood, or even zip code. Many suburbs or neighborhoods in the Cleveland area have a fairly wide range of grades within them, and the same is often true of zip codes.
Some zip codes are fairly consistent across their entirety, such as 44145, which is located entirely within the city of Westlake and is solidly A territory throughout its entirety. However, many zip codes have considerable variability across them; for example 44128, which includes portions of Warrensville Heights, Cleveland, Orange and North Randall, spans from A all the way down to D+! For this reason, it’s advisable to go deeper than just the zip code when determining the grade for potential investment opportunities.
The Cleveland Investor Primer grading scale was created using only objective, measurable data, with a fully transparent methodology in order to give investors the most useful tool possible when assessing any area’s grade for investment analysis purposes. Each census tract in Cuyahoga County was graded using eight parameters, each of which is weighted consistently for each tract in order to ensure complete objectivity and consistency in the process. Each of those parameters, and the respective weighting, is as follows:
- Median Income (20%)
- 5-Year Median Income Change (5%)
- Owner Occupancy Rate (10%)
- Vacancy Rate (20%)
- 5-Year Vacancy Rate Change (5%)
- School District Grade (10%)
- High School Diploma Holder Rate (15%)
- Bachelor’s Degree Holder Rate (15%)
Special Considerations for B & C Grade Neighborhoods
It is important to note that even within a census tract there can be considerable variation that could skew the grade for the specific location of a property. For instance, if a census tract contains blocks of single family houses, but also a large number of senior citizen rental housing apartment communities, the parameters related to income and owner occupancy rate might score far lower than they would have if the senior citizen housing complexes were excluded, thus bringing down the overall grade for the area.
Because of these potential conditions, extra attention should be paid to areas with B or C grades, as it’s entirely possible for a fairly small number of large scale buildings to skew overall grades. If an investor is considering an tract receiving a B or C grade, further due diligence is often needed to determine the level of homogeneity of the tract; if a tract is extremely homogeneous, then the grade can usually be taken at face value. If the tract shows a low level of homogeneity, then it’s important to better understand the composition of the tract.
An actual example of this can be found in census tract 1526.04 in the city of Euclid. Based on the overall grade alone, at face value this tract receives a C- grade. A deep dive into the census tract can be done by looking at a combination of Google Maps and the Cuyahoga County Fiscal Officer’s site. In doing a thorough analysis of the tract, you’ll find that although the tract contains many blocks of very well-maintained single family houses having the general appearance of B or even A grade housing (in the streets off of Glenbrook Boulevard and Chardon Road), there are also over 700 senior housing units contained in buildings near the northeastern corner of the tract, around the intersection of Euclid Avenue and Richmond Road. Because of the large amount of rental housing for seniors who we can reasonably assume are mostly relatively low income, this tract which might have otherwise landed with a grade of B ended up receiving a grade of C-.
Grade Map Deep Dive
The Cleveland Investor Primer Grade Map can be saved and printed to be used for reference during the property search process (Map is best printed in large poster format, at 48 in. by 36 in. size). It has been created using the most current available data as of 2019, and will be updated with future census data as it becomes available.
CLICK HERE TO OPEN HUGE FULLY ZOOMABLE AND PRINTABLE FULL SIZE MAP
The full report card for all Cuyahoga County tracts can be downloaded and used in conjunction with the map. It is set up as an Excel-based table, which allows a user to sort or filter by city name (default view), zip code, census tract overall grade level, etc. By exploring the report card, you can see exactly how each census tract scored in each of the eight graded parameter categories.
CLICK HERE TO DOWNLOAD THE FULL REPORT CARD SPREADSHEET (INDIVIDUAL PARAMETER SCORES FOR EACH TRACT)
Finally, to learn exactly how the individual grades for each of the eight parameters were derived from publicly available data, please review the full methodology using the following link.